This is the English briefing. The full Thai guide includes additional examples and checklists. ไทย ↗
Define the calculation, reporting period and exclusions for each KPI. Separate orders placed, revenue recognized and cash received.
Define the records and rules
Define the calculation, reporting period and exclusions for each KPI. Separate orders placed, revenue recognized and cash received.
Connect the operational workflow
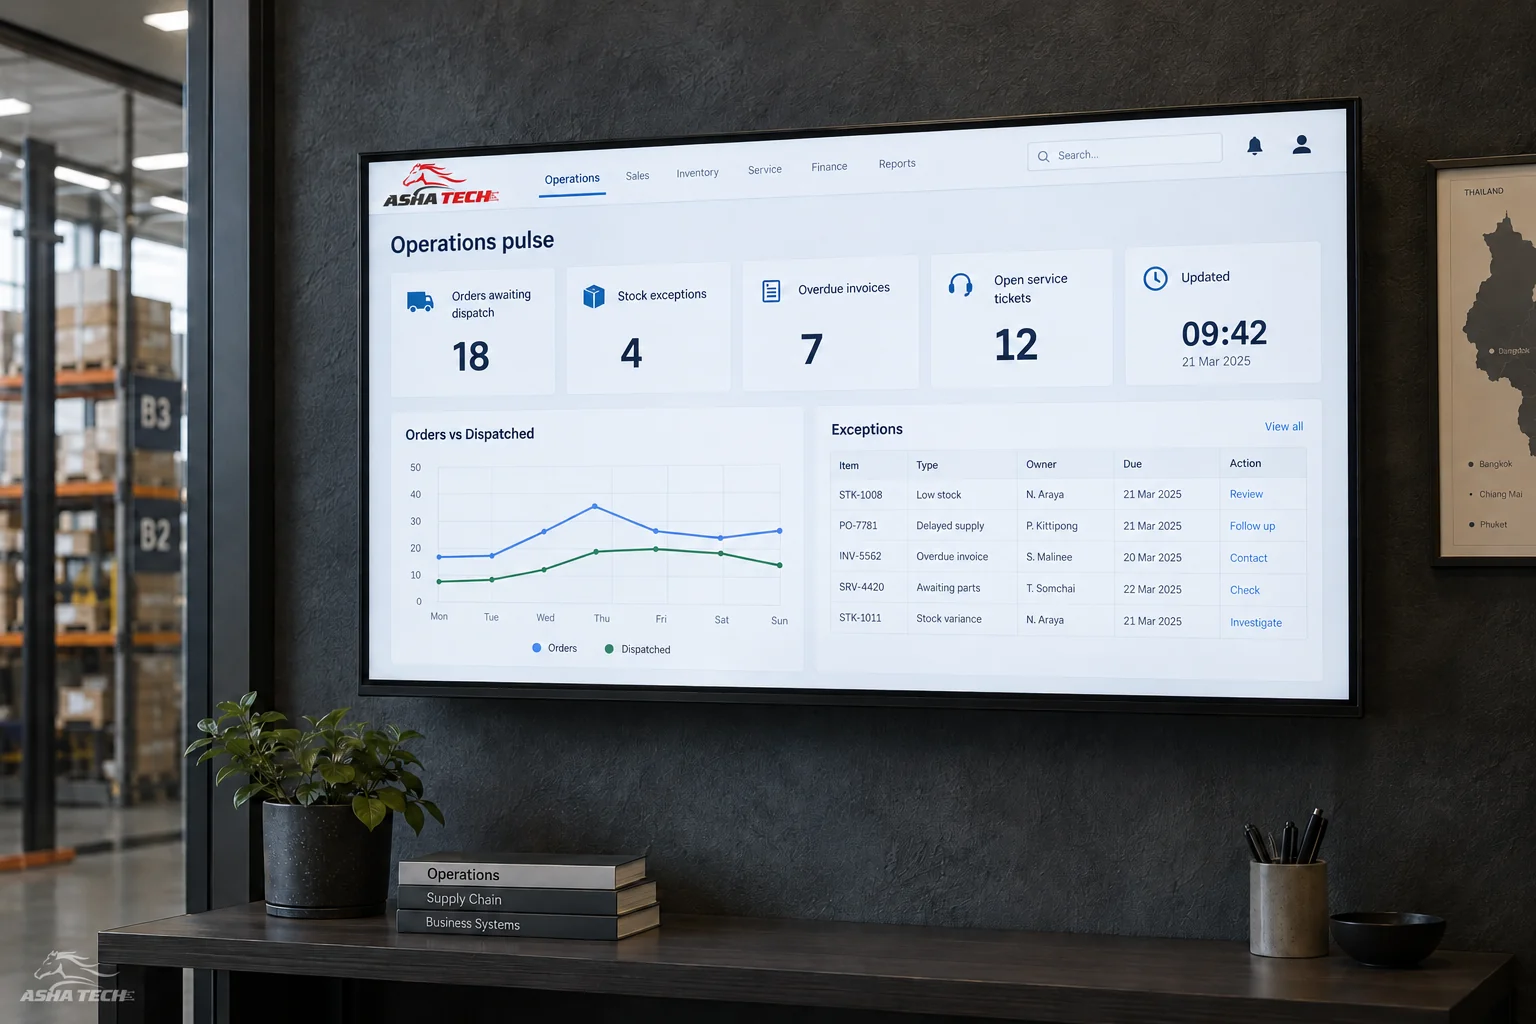
Show data freshness, target and exception context. A warning should identify what action is possible and who owns it.
Checks before implementation
Provide drill-down to the relevant records and reconcile totals. Test empty periods, late updates and filters that change the population being measured.
Further reading from primary sources
These references support the standards and integration topics discussed. Workflow examples and figures illustrate system design.
Sources checked: 11 October 2026. Confirm current API access and requirements before implementation.